Testament to sustained value creation
GROWTH
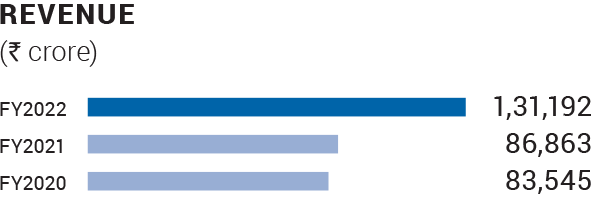
Description: Revenue represents the value of goods sold and services provided to third parties during the year.
Commentary: In FY2022, consolidated revenue was highest ever at `131,192 crore compared with `86,863 crore in FY2021. This was primarily driven by higher commodity prices, higher volumes at Aluminium, Copper, TSPL, IOB and FACOR, increased premium at Aluminium and HZL, rupee depreciation, partially offset by lower power sales at VAL and BALCO.
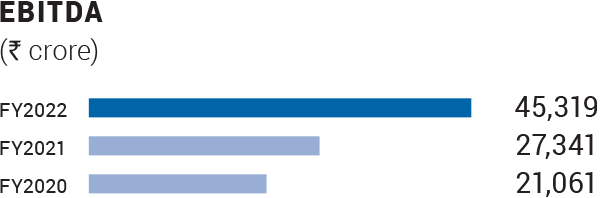
Description: Earnings before interest, tax, depreciation and amortisation (EBITDA) is a factor of volume, prices and cost of production. This measure is calculated by adjusting operating profit for special items and adding depreciation and amortisation.
Commentary: Historical high EBITDA for FY2022 at `45,319 crore, 66% higher y-o-y. This was mainly driven by higher commodity prices at Aluminium, Zinc, Cairn and Iron & Steel and higher sales realisation from Iron ore & Steel business, increased volumes at Aluminium, Zinc International and Iron Ore business, partially offset by headwinds in input commodity prices.
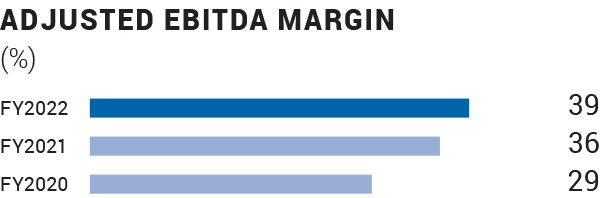
Description: Calculated as EBITDA margin excluding EBITDA and turnover from custom smelting of Copper India and Zinc India businesses.
Commentary: Adjusted EBITDA margin for FY2022 was 39% (FY2021: 36%).
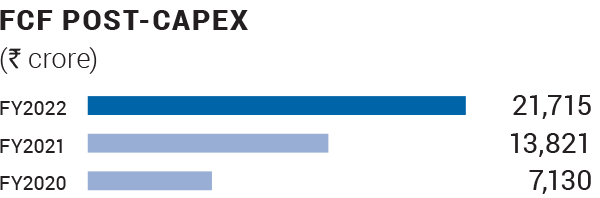
Description: This represents net cash flow from operations after investing in growth projects. This measure ensures that profit generated by our assets is reflected by cash flow, in order to de-lever or maintain future growth or shareholder returns.
Commentary: We generated record high FCF of `21,715 crore in FY2022, driven by strong cash flow from operations, partially offset by higher sustaining and project capital expenditure.
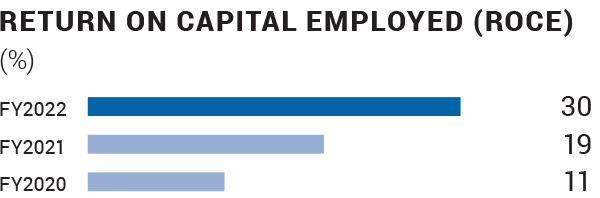
Description: This is calculated on the basis of operating profit, before special items and net of tax outflow, as a ratio of average capital employed. The objective is to earn a post-tax return consistently above the weighted average cost of capital.
Commentary: Strong ROCE of c.30% in FY2022 (FY2021: 19%), primarily due to strong operating and financial performance coupled with higher cash flow from operations.
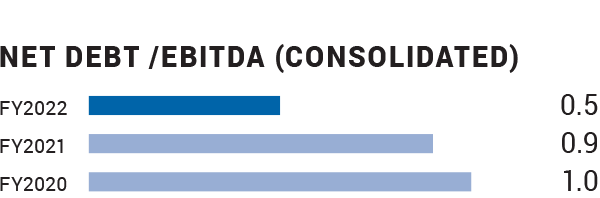
Description: This ratio represents the level of leverage of the Company. It represents the strength of the balance sheet of Vedanta Limited. Net debt is calculated in the manner as defined in Note 18 of the consolidated financial statements.
Commentary: Net debt/EBITDA ratio as at 31 March, 2022 was at 0.5x (lowest in 5 years), compared to 0.9x as at 31 March, 2021.
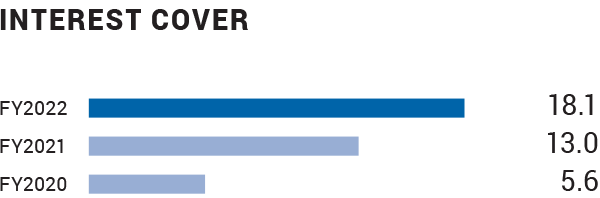
Description: The ratio is a representation of the ability of the Company to service its debt. It is computed as a ratio of EBITDA divided by gross finance costs (including capitalised interest) less investment revenue.
Commentary: The interest cover for the Company was at c. 18.1x, higher y-o-y on account of higher EBITDA.
OTHER KEY FINANCIAL RATIOS
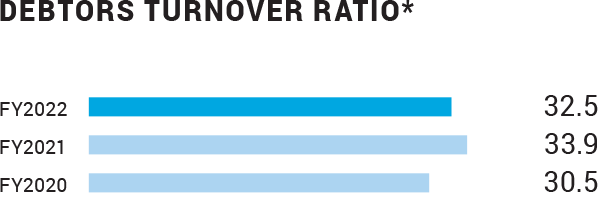
Description: The debtors’ turnover ratio is an accounting measure used to quantify a company’s effectiveness in collecting its receivables. This is calculated as a ratio of revenue from operation to average trade receivables.
Commentary: The debtors turnover ratio was at 32.5x.
*Excluding Power business
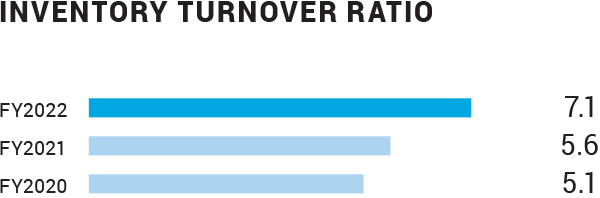
Description: The inventory turnover ratio is an efficiency ratio that shows how effectively inventory is managed. This is calculated as a ratio of cost of goods sold to average inventory
Commentary: The inventory turnover ratio for the Company was at 7.1x in FY2022 as compared to 5.6x in FY2021.
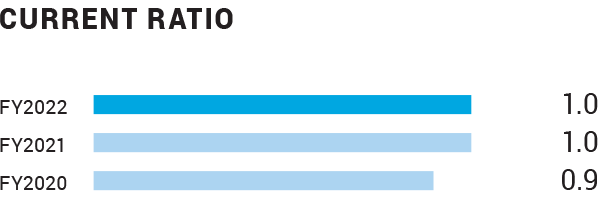
Description: The current ratio is a liquidity ratio that measures a Company’s ability to pay short-term obligations or those due within one year. This is calculated as a ratio of Current Assets to Current Liabilities.
Commentary: The current ratio of the Company remained flat at c.1.0x.
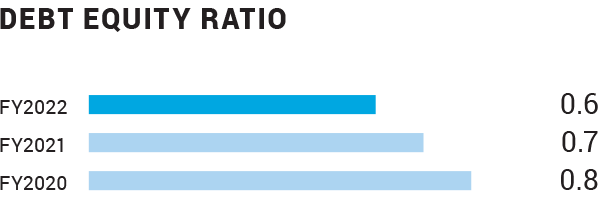
Description: It is a financial ratio indicating the relative proportion of shareholders’ equity and debt used to finance a Company’s assets. This is calculated as a ratio of total external borrowing to total equity (share capital + reserves + minority).
Commentary: The ratio has decreased to 0.6x in FY2022 primarily because of decrease in gross debt due to the repayment of debt at HZL, BALCO and CIHL partially offset by increase in borrowing at Vedanta Standalone.
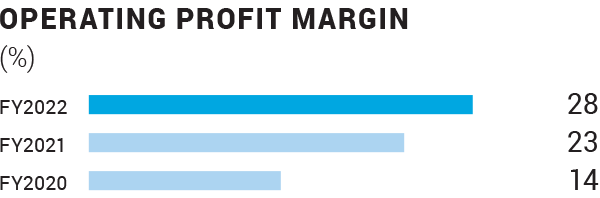
Description: Operating profit margin is a profitability or performance ratio used to calculate the percentage of profit a company produces from its operations. This is calculated as a ratio of operating profit (EBITDA less depreciation) to revenue from operations.
Commentary: The operating profit margin was higher in FY2022 as compared to FY2021, primarily due to higher EBITDA, partially offset by higher depreciation in the current year.
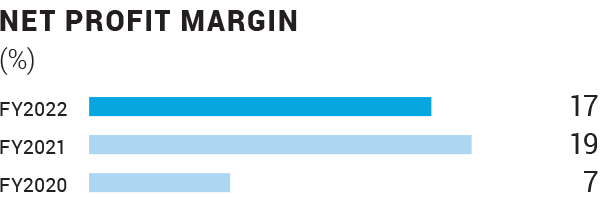
Description: It is a measure of the profitability of the company. This is calculated as a ratio of net profit (before exceptional items) to revenue from operations.
Commentary: The net profit margin was at 17% in FY2022 as compared to 19% in FY2021.
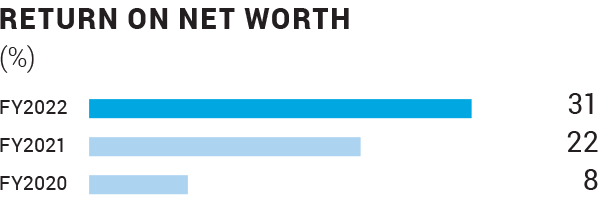
Description: It is a measure of the profitability of the company. This is calculated as a ratio of net profit (before exceptional items) to average net worth (share capital + reserves + minority).
Commentary: The return on net worth has increased, mainly on account of increase in EBITDA during the year.
LONG-TERM VALUE
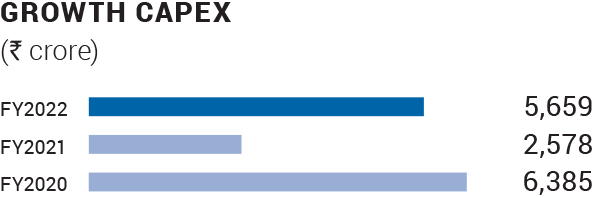
Description: This represents the amount invested in our organic growth programme during the year.
Commentary: Our stated strategy is of disciplined capital allocation on high-return, low-risk projects. Expansion capital expenditure during the year stood at ₹5,659 crore.
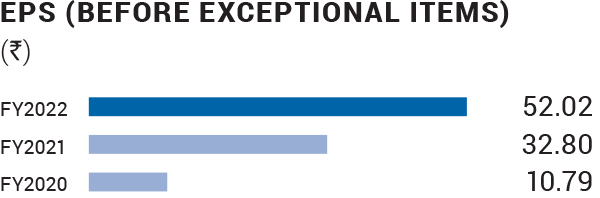
Description: This represents the net profit attributable to equity shareholders and is stated before exceptional items and dividend distribution tax (net of tax and minority interest impacts).
Commentary: In FY2022, EPS before exceptional items was at `52.02 per share. This mainly reflects the impact of lower depreciation charges and higher EBITDA.
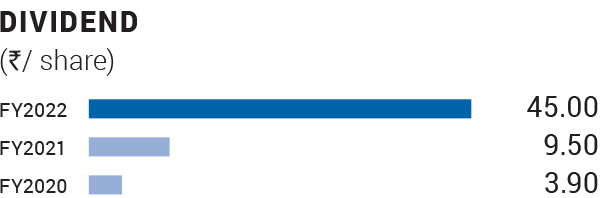
Description: Dividend per share is the total of the final dividend recommended by the Board in relation to the year, and the interim dividend paid out during the year.
Commentary: The Board has recommended a total interim dividend of ₹45 per share this year compared with ₹ 9.50 per share in the previous year.
RESERVES AND RESOURCES (R&R)
Description: Reserves and resources are based on specified guidelines for each commodity and region.
Commentary:
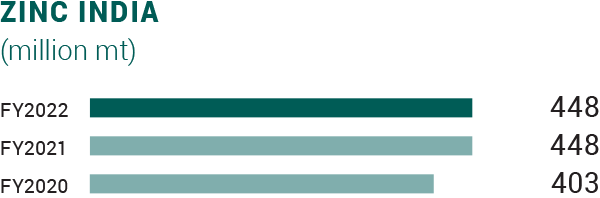
Zinc India:
During the year, combined R&R was estimated to be 448 million
tonnes, containing 31.1 million tonnes of zinc-lead metal and
874.7 million ounces of silver. Overall mine life continues to
be more than 25 years.
Commentary:
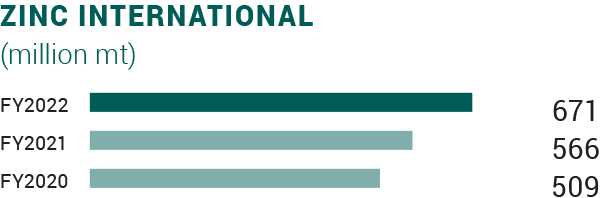
Zinc International:
During the year, combined mineral resources and ore reserves
estimated at 671 million tonnes, containing 35.0 million tonnes
of metal.
Commentary:
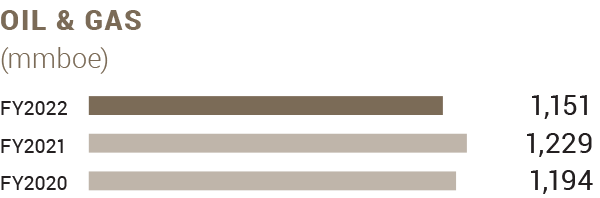
Oil & Gas:
During FY2022, gross proved and probable R&R stood at of 1,151
mmboe.
SUSTAINABLE DEVELOPMENT
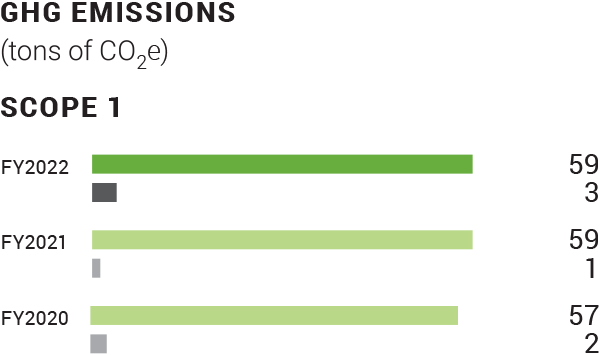
Description: Vedanta used Scope 1 and Scope 2 GHG emissions, measured in Tons of CO2e to track its carbon footprint.
Commentary: We calculate and report Greenhouse Gas (GHG) inventory i.e. Scope 1 (process emissions and other direct emissions) and Scope 2 (purchased electricity) as defined under the World Business Council for Sustainable Development (WBCSD) and World Resource Institute (WRI) GHG Protocol.
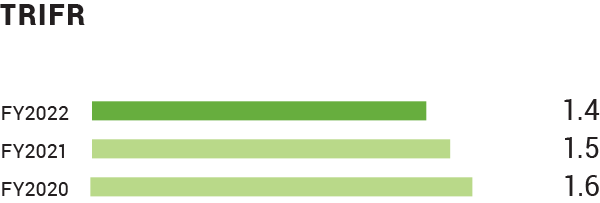
Description: The total recordable injury frequency rate (TRIFR), is the number of fatalities, lost time injuries, and other injuries requiring treatment by a medical professional per million hours worked.
Commentary: This year, the TRIFR was 1.40. Safety remains the key focus across businesses.
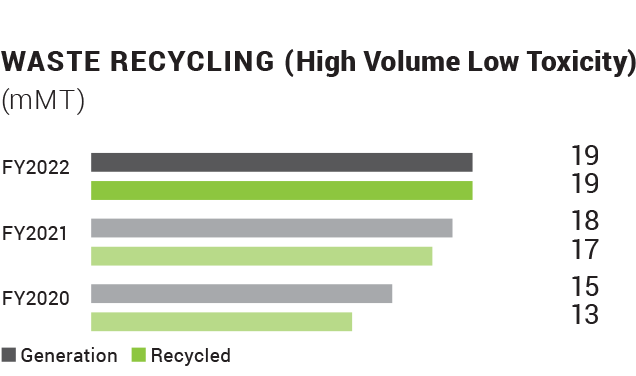
Description: High Volume Low Toxicity (HVLT) are waste present in large quantities and are usually stored in tailings dams/ash-dyes or other secure landfill structures before being sent to other industries as raw materials. HVLT includes fly ash, bottom ash, slag, jarosite, red mud.
Commentary: In FY2022, we achieved ~100% recycling of our HVLT waste.
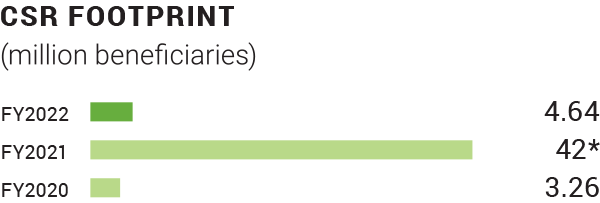
Description: The total number of beneficiaries through our community development programmes across all our operations.
Commentary: We benefited 4.64 million people this year through our community development projects comprising community health, nutrition, education, water and sanitation, sustainable livelihood, women empowerment and bio-investment. This year our large-scale COVID-19 outreach programme further augmented the metric.
*Out of 42 million 39 million are from the e-shiksha program
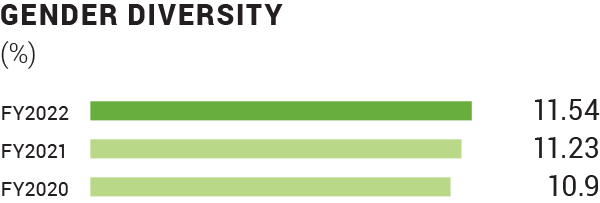
Description: The percentage of women in the total permanent employee workforce.
Commentary: We provide equal opportunities to men and women. During the year, female employees made up 11.54% of the total workforce.
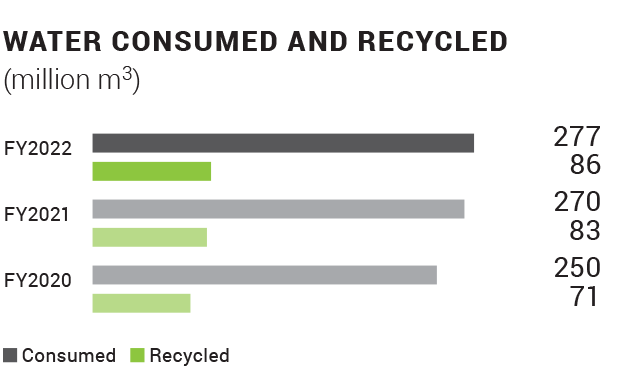
Description: Water consumed is the portion of water use that is not returned to the original source after being withdrawn. Recycled water or reclaimed water means treated or recycled wastewater commonly used for non-potable (not for drinking) purposes, such as agriculture, landscape, public parks, and golf course irrigation (million m3)
Commentary: In FY2022, we recycled 85.8 million m3 of water, equivalent to around 30.6% of consumed water.