We are focussed on optimising capital allocation and maintaining a strong balance sheet while generating strong free cash flows. We also review all investments, taking into account the Group’s financial resources with a view to maximising returns to shareholders.
![]() 6% Y-O-Y
6% Y-O-Y
![]() 19% Y-O-Y
19% Y-O-Y
![]() ~425 bps Y-O-Y
~425 bps Y-O-Y
![]() 172% Y-O-Y
172% Y-O-Y
![]() 30% Y-O-Y
30% Y-O-Y
![]() 34% Y-O-Y
34% Y-O-Y
![]() ~371 bps Y-O-Y
~371 bps Y-O-Y
1 Excluding customs smelter at copper business
We invest in our portfolio of high-quality assets to meet the dynamic market demands. Our commitment extends to acquiring cutting-edge equipment for elevated operational efficiency, safety performance and stable cash flows. We are currently undertaking various vertical integrations and expansion projects to bolster reliable and efficient operations and seize opportunities.
Zinc India
![]() 1% Y-O-Y
1% Y-O-Y
Zinc India
![]() 2% Y-O-Y
2% Y-O-Y
Zinc India
Zinc International
Aluminium
![]() 2% Y-O-Y
2% Y-O-Y
Aluminium
![]() 9% Y-O-Y
9% Y-O-Y
Oil & Gas
![]() 19% Y-O-Y
19% Y-O-Y
Power
Iron Ore
![]() 12% Y-O-Y
12% Y-O-Y
Steel
Ferro Alloys
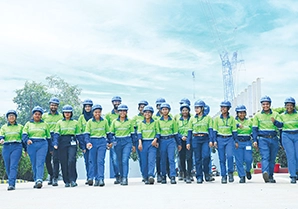
We hire people from around the world. Our employees’ diverse skills and varied experience effectively contributes to our operations. For our mining and plant operations that require specialised skills, we employ qualified technical, engineering and geology professionals. Additionally, we foster a culture that nurtures safety, innovation, creativity and diversity, which helps us to achieve our business goals while also enabling our employees to grow personally and advance professionally.
Our collective knowledge, skills and resources are key to ensuring optimal and sustainable operations and driving our value creation. Our ongoing investments in innovation, digital transformation and technology help strengthen our competitiveness and business resilience.
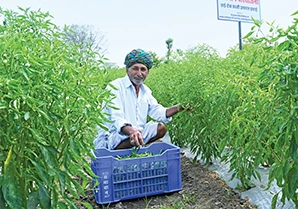
We aim to forge strong partnerships with our key stakeholders, including shareholders and lenders, suppliers and contractors, employees, governments, communities and civil societies. Our meaningful engagement with them helps us to foster these strong connections that help us to maintain and strengthen our licence to operate.
We own world-class mining assets in India and Africa, endowed with abundant natural resources and reserves (R&R), giving us long-term visibility to sustain operations. We effectively use these assets to generate significant social and economic value for our stakeholders. However, our operations also have associated environmental impacts, which we are striving to minimise by operating responsibly and investing in environmental stewardship.
Zinc India R&R
Zinc India R&R
Zinc India R&R
Zinc International R&R
Zinc International R&R
Oil and Gas R&R